
Carbon Fiber Composites Market Growth Analysis Research Report By End-Use (Aerospace, Automotive, Wind Turbines, Sport & Leisure, Civil Engineering, Marine), And By Matrix Material (Polymer [Thermosetting, Thermoplastics], Carbon, Ceramic, Metal, Hybrid) And Region, Trends, Dynamics And Forecast From 2023 To 2030
Pages: 123 | Nov-2023 Formats | PDF | Category: Chemical & Materials | Delivery: 24 to 72 Hours
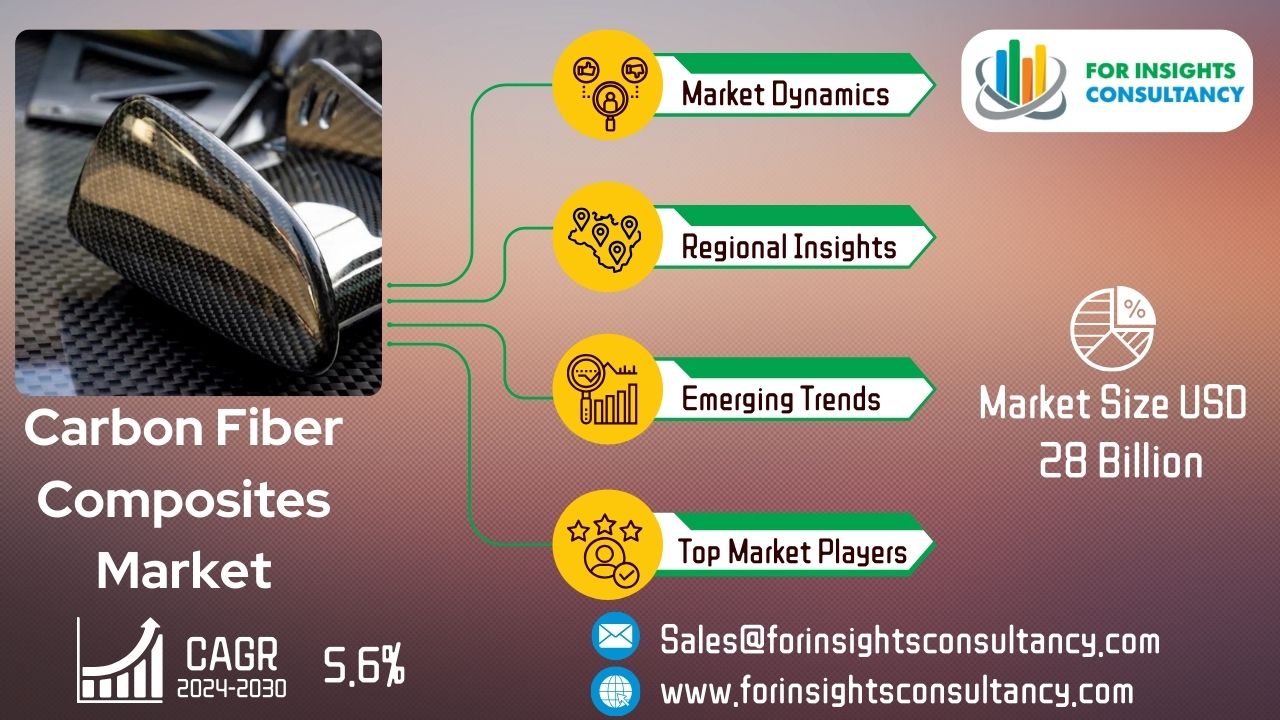
Carbon Fiber Composites Market Snapshot
“The Carbon Fiber Composites Market Predictable to increase at a CAGR of 5.6% from its Size $21.20 Billion in 2023 to $28 Billion by 2030.”
Carbon fiber composites are a lightweight and strong material made by combining carbon fibers with a polymer matrix. Carbon fibers are formed by the binding of carbon atoms in a long, thin crystal structure. The typical diameter of the fibers is 5 to 10 micrometers, but they can be several centimeters long.
The carbon fiber composites market is seeing tremendous growth due to the demand for lightweight and high-strength materials in several end-use industries, such as aerospace and military, automotive, wind energy, and sports and leisure. The combination of carbon fibers with a polymer matrix gives carbon fiber composites their remarkable durability and high strength-to-weight ratios.
In the coming years, carbon fiber composites are expected to see increased demand from many end-use industries, such as aerospace and defense, wind energy, automotive, sports and leisure, and more. Carbon fiber composites are expected to see substantial development in the aerospace and military industries, thanks to their widespread use in aircraft and spacecraft construction, which significantly reduces weight and improves fuel economy. The rising demand for electric vehicles is expected to be good news for carbon fiber composites, since they will enhance the efficiency and driving range of these vehicles.
>>> Download Sample Report Now: https://www.forinsightsconsultancy.com/reports/request-sample-carbon-fiber-composites-market/
|
Attributes |
Carbon Fiber Composites Market |
|
CAGR (2023 to 2030) |
5.6% |
|
Market Value (2030) |
US$ 28 Billion |
|
Growth Factor |
unique characteristics, such as extreme strength, |
|
Opportunity |
Automotive manufacturers are actively investing in research and development to create advanced materials for high-volume production vehicles. |
Segment Analysis
There are several submarkets within the global carbon fiber composites market, each serving a specific end-use: aerospace, wind turbines, sport and leisure, civil engineering, marine, and automotive.
The aerospace and defense sector is expected to provide the most revenue and have the largest market share for these materials. This is because they are extensively used in aircraft components such airframe structures, floor panels, and landing gears. Incorporating carbon fibers, like those found in Carbon-fiber Reinforced Plastic (CFRP), into aviation components enhances their resistance to corrosion and fatigue.
The Carbon Fiber Composites Industry on a Global Scale Analysis Carbon, ceramic, metal, thermosetting thermoplastics, and hybrids are the five main categories of materials.
The polymer materials category is expected to create the greatest revenue and dominate the market. This is because numerous polymers have been developed and are widely used in the aerospace and automotive industries. Another material that is expected to experience significant expansion is thermosetting polymers. These polymers find widespread use in crucial aircraft components and have numerous uses in the defense sector. Increased market share is another benefit of improved adhesion and surface finishing.
Competitive Landscape
- Toray Industries Inc. (Japan)
- DowAksa (Turkey)
- Mitsubishi Chemical Corporation (Japan)
- Solvay (Belgium)
- Teijin Limited (Japan)
- SGL Carbon (Germany)
- Hexcel Corporation (US)
- Hyosung Advanced Materials (South Korea)
- Zhongfu Shenying Carbon Co. Ltd. (China)
- Formosa Plastics Corporation (Taiwan)
- Jiangsu Hengshen Co. Ltd. (China)
- Jilin Chemical Fiber Group Co. Ltd. (China)
Recent Developments
September 2023: Teijin Limited agreed to sell its entire investment in GH Craft Co. Ltd, an equity-method subsidiary of Teijin’s composites business in Japan, to TIP Composite Co. Ltd (Tokyo). Teijin acquired GH Craft as part of its downstream strategy in July 2008.
April 2023: Solvay and GKN Aerospace extended their collaboration agreement struck in 2017. Under the terms of the agreement, both companies will create a combined thermoplastic composites (TPC) roadmap to investigate innovative materials and production techniques for aircraft structures, as well as jointly target future key high-rate programs. Furthermore, Solvay will continue to be a preferred supplier of TPC materials to GKN Aerospace.
In November 2022, Hyosung Advanced Materials acquired ISCC (International Sustainability & Carbon Certification) PLUS. This acquisition is expected to boost the operational capabilities of Hyosung Advanced Materials.
September 2022- Solvay launched LTM 350, a next-generation epoxy prepreg carbon fiber tooling material designed to deliver significant cost and time savings for the aerospace, industrial, automotive and race car markets.
In July 2022, Hexcel announced that it has signed a long-term agreement with Dassault to supply carbon fiber prepreg for the Falcon 10X program. This is the first Dassault business jet program to incorporate high-performance advanced carbon fiber composites in the manufacture of its aircraft wings.
Carbon Fiber Composites Market Regional Insights
North America holds approximately around 30% of the market share. Due to the region’s major aerospace and defense industries, North America is anticipated to be a significant market for carbon fiber composites. North America’s biggest markets for carbon fiber composites are the United States, Canada, and Mexico.
Due to the region’s substantial aerospace and defense industries, Europe is also anticipated to be a sizable market for carbon fiber composites. Major markets for carbon fiber composites in Europe include nations like Germany, the UK, and France.
The aerospace and defense, automotive, and wind energy industries’ rising need for carbon fiber composites is predicted to make the Asia-Pacific area the region with the fastest-growing market for these materials. Major markets for carbon fiber composites in the Asia-Pacific area include South Korea, China, and Japan.
Segments
Carbon Fiber Composites Market By End-User Industry
- Aerospace
- Automotive
- Wind Turbines
- Sport & Leisure
- Civil Engineering
- Marine
Carbon Fiber Composites Market By Matrix Material
- Polymer
- Thermosetting
- Thermoplastics
- Carbon
- Ceramic
- Metal
- Hybrid
Carbon Fiber Composites Market By Region
- North America
- Asia Pacific
- Europe
- South America
- Middle East And Africa
Frequently asked questions with answers
What is the worth of the global Carbon Fiber Composites Market?
The Carbon Fiber Composites Market Predictable to increase at a CAGR of 5.6% from its Size $21.20 Billion in 2023 to $28 Billion by 2030.
What is the size of the North America Carbon Fiber Composites industry?
North America holds approximately around 30% of the market share. Due to the region’s major aerospace and defense industries, North America is anticipated to be a significant market for carbon fiber composites. North America’s biggest markets for carbon fiber composites are the United States, Canada, and Mexico.
What are some of the market’s driving forces?
The demand for lightweight and high-strength materials in a variety of end-use industries, including aerospace and defense, automotive, wind energy, and sports and leisure, is fueling the rapid growth of the carbon fiber composites market. Carbon fiber composites have great strength-to-weight ratios and exceptional durability because they are constructed of carbon fibers and a polymer matrix.
The market is anticipated to keep expanding in the upcoming years due to factors including the rising demand for electric vehicles, the increased usage of carbon fiber composites in wind energy, and the growing use of carbon fiber composites in the aerospace and military industries.
Which is the leading end-user industry in this market?
Due to the widespread use of these materials in aircraft components such as airframe structures, floor panels, and landing gears, the aerospace & defense segment has the largest market share and is predicted to generate the highest level of revenue in the market. The corrosion and fatigue-resistant properties of aircraft parts can be improved by the use of carbon fibers, such as Carbon-fiber Reinforced Plastic (CFRP).
Which are the top companies to hold the market share in the Carbon Fiber Composites market?
Key Players Profiled in The Report Include Toray Industries Inc., (Japan), DowAksa (Turkey), Mitsubishi Chemical Corporation (Japan), Solvay (Belgium), Teijin Limited (Japan), SGL Carbon (Germany), Hexcel Corporation (US), Hyosung Advanced Materials (South Korea), Zhongfu Shenying Carbon Co., Ltd. (China), Formosa Plastics Corporation (Taiwan), Jiangsu Hengshen Co., Ltd. (China), and Jilin Chemical Fiber Group Co., Ltd. (China)
Which is the largest regional market for Carbon Fiber Composites market?
In terms of revenue generation and largest market share North America dominates the Carbon Fiber Composites market
TABLE OF CONTENT
- INTRODUCTION
1.1. MARKET DEFINITION
1.2. MARKET SEGMENTATION
1.3. RESEARCH TIMELINES
1.4. ASSUMPTIONS AND LIMITATIONS
- RESEARCH METHODOLOGY
2.1. DATA MINING
2.1.1. SECONDARY RESEARCH
2.1.2. PRIMARY RESEARCH
2.1.3. SUBJECT-MATTER EXPERTS’ ADVICE
2.2. QUALITY CHECKS
2.2.1. FINAL REVIEW
2.3. DATA TRIANGULATION
2.3.1. BOTTOM-UP APPROACH
2.3.2. TOP-DOWN APPROACH
2.3.3. RESEARCH FLOW
2.4. DATA SOURCES
- EXECUTIVE SUMMARY
- MARKET OVERVIEW
4.1. GLOBAL CARBON FIBER COMPOSITES MARKET OUTLOOK
4.1.1. MARKET DRIVERS
4.1.2. MARKET RESTRAINTS
4.1.3. MARKET OPPORTUNITIES
4.2. IMPACT OF COVID-19 ON CARBON FIBER COMPOSITES MARKET
4.3. PORTER’S FIVE FORCES MODEL
4.3.1. THREAT FROM NEW ENTRANTS
4.3.2. THREAT FROM SUBSTITUTES
4.3.3. BARGAINING POWER OF SUPPLIERS
4.3.4. BARGAINING POWER OF CUSTOMERS
4.3.5. DEGREE OF COMPETITION
4.4. INDUSTRY VALUE CHAIN ANALYSIS
- GLOBAL CARBON FIBER COMPOSITES MARKET BY END-USER INDUSTRY, 2018-2030, (USD BILLION), (THOUSAND UNITS)
5.1. AEROSPACE
5.2. AUTOMOTIVE
5.3. WIND TURBINES
5.4. SPORT & LEISURE
5.5. CIVIL ENGINEERING
5.6. MARINE
- GLOBAL CARBON FIBER COMPOSITES MARKET BY MATRIX MATERIAL, 2018-2030, (USD BILLION), (THOUSAND UNITS)
6.1. POLYMER
6.1.1. THERMOSETTING
6.1.2. THERMOPLASTICS
6.2. CARBON
6.3. CERAMIC
6.4. METAL
6.5. HYBRID
- GLOBAL MARKET BY REGION, 2018-2030, (USD BILLION), (THOUSAND UNITS)
7.1. NORTH AMERICA
7.1.1. US
7.1.2. CANADA
7.1.3. MEXICO
7.2. SOUTH AMERICA
7.2.1. BRAZIL
7.2.2. ARGENTINA
7.2.3. COLOMBIA
7.2.4. REST OF SOUTH AMERICA
7.3. EUROPE
7.3.1. GERMANY
7.3.2. UK
7.3.3. FRANCE
7.3.4. ITALY
7.3.5. SPAIN
7.3.6. RUSSIA
7.3.7. REST OF EUROPE
7.4. ASIA PACIFIC
7.4.1. INDIA
7.4.2. CHINA
7.4.3. JAPAN
7.4.4. SOUTH KOREA
7.4.5. AUSTRALIA
7.4.6. SOUTH-EAST ASIA
7.4.7. REST OF ASIA PACIFIC
7.5. MIDDLE EAST AND AFRICA
7.5.1. UAE
7.5.2. SAUDI ARABIA
7.5.3. SOUTH AFRICA
7.5.4. REST OF MIDDLE EAST AND AFRICA
- COMPANY PROFILES
8.1. TORAY INDUSTRIES INC.
8.2. DOWAKSA
8.3. MITSUBISHI CHEMICAL CORPORATION
8.4. SOLVAY
8.5. TEIJIN LIMITED
8.6. SGL CARBON
8.7. HEXCEL CORPORATION
8.8. HYOSUNG ADVANCED MATERIALS
8.9. ZHONGFU SHENYING CARBON CO., LTD.
8.10.FORMOSA PLASTICS CORPORATION
8.11.JIANGSU HENGSHEN CO., LTD.
8.12.JILIN CHEMICAL FIBER GROUP CO., LTD.
LIST OF TABLES
TABLE 1 GLOBAL CARBON FIBER COMPOSITES MARKET BY MATRIX MATERIAL (USD BILLION) 2018-2030
TABLE 2 GLOBAL CARBON FIBER COMPOSITES MARKET BY MATRIX MATERIAL (KILOTONS) 2018-2030
TABLE 3 GLOBAL CARBON FIBER COMPOSITES MARKET BY END USER (USD BILLION) 2018-2030
TABLE 4 GLOBAL CARBON FIBER COMPOSITES MARKET BY END USER (KILOTONS) 2018-2030
TABLE 5 GLOBAL CARBON FIBER COMPOSITES MARKET BY REGION (USD BILLION) 2018-2030
TABLE 6 GLOBAL MARKET BY REGION (KILOTONS) 2018-2030
TABLE 7 NORTH AMERICA CARBON FIBER COMPOSITES MARKET BY COUNTRY (USD BILLION) 2018-2030
TABLE 8 NORTH AMERICA MARKET BY COUNTRY (KILOTONS) 2018-2030
TABLE 9 NORTH AMERICA MARKET BY MATRIX MATERIAL (USD BILLION) 2018-2030
TABLE 10 NORTH AMERICA MARKET BY MATRIX MATERIAL (KILOTONS) 2018-2030
TABLE 11 NORTH AMERICA MARKET BY END USER (USD BILLION) 2018-2030
TABLE 12 NORTH AMERICA MARKET BY END USER (KILOTONS) 2018-2030
TABLE 13 US CARBON FIBER COMPOSITES MARKET BY MATRIX MATERIAL (USD BILLION) 2018-2030
TABLE 14 US MARKET BY MATRIX MATERIAL (KILOTONS) 2018-2030
TABLE 15 US MARKET BY END USER (USD BILLION) 2018-2030
TABLE 16 US MARKET BY END USER (KILOTONS) 2018-2030
TABLE 17 CANADA CARBON FIBER COMPOSITES MARKET BY MATRIX MATERIAL (USD BILLION) 2018-2030
TABLE 18 CANADA MARKET BY MATRIX MATERIAL (KILOTONS) 2018-2030
TABLE 19 CANADA MARKET BY END USER (USD BILLION) 2018-2030
TABLE 20 CANADA MARKET BY END USER (KILOTONS) 2018-2030
TABLE 21 MEXICO CARBON FIBER COMPOSITES MARKET BY MATRIX MATERIAL (USD BILLION) 2018-2030
TABLE 22 MEXICO MARKET BY MATRIX MATERIAL (KILOTONS) 2018-2030
TABLE 23 MEXICO MARKET BY END USER (USD BILLION) 2018-2030
TABLE 24 MEXICO MARKET BY END USER (KILOTONS) 2018-2030
TABLE 25 SOUTH AMERICA CARBON FIBER COMPOSITES MARKET BY COUNTRY (USD BILLION) 2018-2030
TABLE 26 SOUTH AMERICA MARKET BY COUNTRY (KILOTONS) 2018-2030
TABLE 27 SOUTH AMERICA MARKET BY MATRIX MATERIAL (USD BILLION) 2018-2030
TABLE 28 SOUTH AMERICA MARKET BY MATRIX MATERIAL (KILOTONS) 2018-2030
TABLE 29 SOUTH AMERICA MARKET BY END USER (USD BILLION) 2018-2030
TABLE 30 SOUTH AMERICA MARKET BY END USER (KILOTONS) 2018-2030
TABLE 31 BRAZIL CARBON FIBER COMPOSITES MARKET BY MATRIX MATERIAL (USD BILLION) 2018-2030
TABLE 32 BRAZIL MARKET BY MATRIX MATERIAL (KILOTONS) 2018-2030
TABLE 33 BRAZIL MARKET BY END USER (USD BILLION) 2018-2030
TABLE 34 BRAZIL MARKET BY END USER (KILOTONS) 2018-2030
TABLE 35 ARGENTINA CARBON FIBER COMPOSITES MARKET BY MATRIX MATERIAL (USD BILLION) 2018-2030
TABLE 36 ARGENTINA MARKET BY MATRIX MATERIAL (KILOTONS) 2018-2030
TABLE 37 ARGENTINA MARKET BY END USER (USD BILLION) 2018-2030
TABLE 38 ARGENTINA MARKET BY END USER (KILOTONS) 2018-2030
TABLE 39 COLOMBIA CARBON FIBER COMPOSITES MARKET BY MATRIX MATERIAL (USD BILLION) 2018-2030
TABLE 40 COLOMBIA MARKET BY MATRIX MATERIAL (KILOTONS) 2018-2030
TABLE 41 COLOMBIA MARKET BY END USER (USD BILLION) 2018-2030
TABLE 42 COLOMBIA MARKET BY END USER (KILOTONS) 2018-2030
TABLE 43 REST OF SOUTH AMERICA CARBON FIBER COMPOSITES MARKET BY MATRIX MATERIAL (USD BILLION) 2018-2030
TABLE 44 REST OF SOUTH AMERICA MARKET BY MATRIX MATERIAL (KILOTONS) 2018-2030
TABLE 45 REST OF SOUTH AMERICA MARKET BY END USER (USD BILLION) 2018-2030
TABLE 46 REST OF SOUTH AMERICA MARKET BY END USER (KILOTONS) 2018-2030
TABLE 47 ASIA-PACIFIC CARBON FIBER COMPOSITES MARKET BY COUNTRY (USD BILLION) 2018-2030
TABLE 48 ASIA-PACIFIC MARKET BY COUNTRY (KILOTONS) 2018-2030
TABLE 49 ASIA-PACIFIC MARKET BY MATRIX MATERIAL (USD BILLION) 2018-2030
TABLE 50 ASIA-PACIFIC MARKET BY MATRIX MATERIAL (KILOTONS) 2018-2030
TABLE 51 ASIA-PACIFIC MARKET BY END USER (USD BILLION) 2018-2030
TABLE 52 ASIA-PACIFIC MARKET BY END USER (KILOTONS) 2018-2030
TABLE 53 INDIA CARBON FIBER COMPOSITES MARKET BY MATRIX MATERIAL (USD BILLION) 2018-2030
TABLE 54 INDIA MARKET BY MATRIX MATERIAL (KILOTONS) 2018-2030
TABLE 55 INDIA MARKET BY END USER (USD BILLION) 2018-2030
TABLE 56 INDIA MARKET BY END USER (KILOTONS) 2018-2030
TABLE 57 CHINA CARBON FIBER COMPOSITES MARKET BY MATRIX MATERIAL (USD BILLION) 2018-2030
TABLE 58 CHINA MARKET BY MATRIX MATERIAL (KILOTONS) 2018-2030
TABLE 59 CHINA MARKET BY END USER (USD BILLION) 2018-2030
TABLE 60 CHINA MARKET BY END USER (KILOTONS) 2018-2030
TABLE 61 JAPAN CARBON FIBER COMPOSITES MARKET BY MATRIX MATERIAL (USD BILLION) 2018-2030
TABLE 62 JAPAN MARKET BY MATRIX MATERIAL (KILOTONS) 2018-2030
TABLE 63 JAPAN MARKET BY END USER (USD BILLION) 2018-2030
TABLE 64 JAPAN MARKET BY END USER (KILOTONS) 2018-2030
TABLE 65 SOUTH KOREA CARBON FIBER COMPOSITES MARKET BY MATRIX MATERIAL (USD BILLION) 2018-2030
TABLE 66 SOUTH KOREA MARKET BY MATRIX MATERIAL (KILOTONS) 2018-2030
TABLE 67 SOUTH KOREA MARKET BY END USER (USD BILLION) 2018-2030
TABLE 68 SOUTH KOREA MARKET BY END USER (KILOTONS) 2018-2030
TABLE 69 AUSTRALIA CARBON FIBER COMPOSITES MARKET BY MATRIX MATERIAL (USD BILLION) 2018-2030
TABLE 70 AUSTRALIA MARKET BY MATRIX MATERIAL (KILOTONS) 2018-2030
TABLE 71 AUSTRALIA MARKET BY END USER (USD BILLION) 2018-2030
TABLE 72 AUSTRALIA MARKET BY END USER (KILOTONS) 2018-2030
TABLE 73 SOUTH-EAST ASIA CARBON FIBER COMPOSITES MARKET BY MATRIX MATERIAL (USD BILLION) 2018-2030
TABLE 74 SOUTH-EAST ASIA MARKET BY MATRIX MATERIAL (KILOTONS) 2018-2030
TABLE 75 SOUTH-EAST ASIA MARKET BY END USER (USD BILLION) 2018-2030
TABLE 76 SOUTH-EAST ASIA MARKET BY END USER (KILOTONS) 2018-2030
TABLE 77 REST OF ASIA PACIFIC CARBON FIBER COMPOSITES MARKET BY MATRIX MATERIAL (USD BILLION) 2018-2030
TABLE 78 REST OF ASIA PACIFIC MARKET BY MATRIX MATERIAL (KILOTONS) 2018-2030
TABLE 79 REST OF ASIA PACIFIC MARKET BY END USER (USD BILLION) 2018-2030
TABLE 80 REST OF ASIA PACIFIC MARKET BY END USER (KILOTONS) 2018-2030
TABLE 81 EUROPE CARBON FIBER COMPOSITES MARKET BY COUNTRY (USD BILLION) 2018-2030
TABLE 82 EUROPE MARKET BY COUNTRY (KILOTONS) 2018-2030
TABLE 83 ASIA-PACIFIC CARBON FIBER COMPOSITES MARKET BY MATRIX MATERIAL (USD BILLION) 2018-2030
TABLE 84 ASIA-PACIFIC MARKET BY MATRIX MATERIAL (KILOTONS) 2018-2030
TABLE 85 ASIA-PACIFIC MARKET BY END USER (USD BILLION) 2018-2030
TABLE 86 ASIA-PACIFIC MARKET BY END USER (KILOTONS) 2018-2030
TABLE 87 GERMANY MARKET BY MATRIX MATERIAL (USD BILLION) 2018-2030
TABLE 88 GERMANY CARBON FIBER COMPOSITES MARKET BY MATRIX MATERIAL (KILOTONS) 2018-2030
TABLE 89 GERMANY MARKET BY END USER (USD BILLION) 2018-2030
TABLE 90 GERMANY MARKET BY END USER (KILOTONS) 2018-2030
TABLE 91 UK CARBON FIBER COMPOSITES MARKET BY MATRIX MATERIAL (USD BILLION) 2018-2030
TABLE 92 UK MARKET BY MATRIX MATERIAL (KILOTONS) 2018-2030
TABLE 93 UK MARKET BY END USER (USD BILLION) 2018-2030
TABLE 94 UK MARKET BY END USER (KILOTONS) 2018-2030
TABLE 95 FRANCE CARBON FIBER COMPOSITES MARKET BY MATRIX MATERIAL (USD BILLION) 2018-2030
TABLE 96 FRANCE MARKET BY MATRIX MATERIAL (KILOTONS) 2018-2030
TABLE 97 FRANCE MARKET BY END USER (USD BILLION) 2018-2030
TABLE 98 FRANCE MARKET BY END USER (KILOTONS) 2018-2030
TABLE 99 ITALY CARBON FIBER COMPOSITES MARKET BY MATRIX MATERIAL (USD BILLION) 2018-2030
TABLE 100 ITALY MARKET BY MATRIX MATERIAL (KILOTONS) 2018-2030
TABLE 101 ITALY MARKET BY END USER (USD BILLION) 2018-2030
TABLE 102 ITALY MARKET BY END USER (KILOTONS) 2018-2030
TABLE 103 SPAIN CARBON FIBER COMPOSITES MARKET BY MATRIX MATERIAL (USD BILLION) 2018-2030
TABLE 104 SPAIN MARKET BY MATRIX MATERIAL (KILOTONS) 2018-2030
TABLE 105 SPAIN MARKET BY END USER (USD BILLION) 2018-2030
TABLE 106 SPAIN MARKET BY END USER (KILOTONS) 2018-2030
TABLE 107 RUSSIA CARBON FIBER COMPOSITES MARKET BY MATRIX MATERIAL (USD BILLION) 2018-2030
TABLE 108 RUSSIA MARKET BY MATRIX MATERIAL (KILOTONS) 2018-2030
TABLE 109 RUSSIA MARKET BY END USER (USD BILLION) 2018-2030
TABLE 110 RUSSIA MARKET BY END USER (KILOTONS) 2018-2030
TABLE 111 REST OF EUROPE CARBON FIBER COMPOSITES MARKET BY MATRIX MATERIAL (USD BILLION) 2018-2030
TABLE 112 REST OF EUROPE MARKET BY MATRIX MATERIAL (KILOTONS) 2018-2030
TABLE 113 REST OF EUROPE MARKET BY END USER (USD BILLION) 2018-2030
TABLE 114 REST OF EUROPE MARKET BY END USER (KILOTONS) 2018-2030
TABLE 115 MIDDLE EAST AND AFRICA CARBON FIBER COMPOSITES MARKET BY COUNTRY (USD BILLION) 2018-2030
TABLE 116 MIDDLE EAST AND AFRICA MARKET BY COUNTRY (KILOTONS) 2018-2030
TABLE 117 MIDDLE EAST AND AFRICA MARKET BY MATRIX MATERIAL (USD BILLION) 2018-2030
TABLE 118 MIDDLE EAST AND AFRICA MARKET BY MATRIX MATERIAL (KILOTONS) 2018-2030
TABLE 119 MIDDLE EAST AND AFRICA MARKET BY END USER (USD BILLION) 2018-2030
TABLE 120 MIDDLE EAST AND AFRICA MARKET BY END USER (KILOTONS) 2018-2030
TABLE 121 UAE CARBON FIBER COMPOSITES MARKET BY MATRIX MATERIAL (USD BILLION) 2018-2030
TABLE 122 UAE MARKET BY MATRIX MATERIAL (KILOTONS) 2018-2030
TABLE 123 UAE MARKET BY END USER (USD BILLION) 2018-2030
TABLE 124 UAE MARKET BY END USER (KILOTONS) 2018-2030
TABLE 125 SAUDI ARABIA CARBON FIBER COMPOSITES MARKET BY MATRIX MATERIAL (USD BILLION) 2018-2030
TABLE 126 SAUDI ARABIA MARKET BY MATRIX MATERIAL (KILOTONS) 2018-2030
TABLE 127 SAUDI ARABIA MARKET BY END USER (USD BILLION) 2018-2030
TABLE 128 SAUDI ARABIA MARKET BY END USER (KILOTONS) 2018-2030
TABLE 129 SOUTH AFRICA CARBON FIBER COMPOSITES MARKET BY MATRIX MATERIAL (USD BILLION) 2018-2030
TABLE 130 SOUTH AFRICA MARKET BY MATRIX MATERIAL (KILOTONS) 2018-2030
TABLE 131 SOUTH AFRICA MARKET BY END USER (USD BILLION) 2018-2030
TABLE 132 SOUTH AFRICA MARKET BY END USER (KILOTONS) 2018-2030
TABLE 133 REST OF MIDDLE EAST AND AFRICA BY MATRIX MATERIAL (USD BILLION) 2018-2030
TABLE 134 REST OF MIDDLE EAST AND AFRICA MARKET BY MATRIX MATERIAL (KILOTONS) 2018-2030
TABLE 135 REST OF MIDDLE EAST AND AFRICA MARKET BY END USER (USD BILLION) 2018-2030
TABLE 136 REST OF MIDDLE EAST AND AFRICA CARBON FIBER COMPOSITES MARKET BY END USER (KILOTONS) 2018-2030
LIST OF FIGURES
FIGURE 1 MARKET DYNAMICS
FIGURE 2 MARKET SEGMENTATION
FIGURE 3 REPORT TIMELINES: YEARS CONSIDERED
FIGURE 4 DATA TRIANGULATION
FIGURE 5 BOTTOM-UP APPROACH
FIGURE 6 TOP-DOWN APPROACH
FIGURE 7 RESEARCH FLOW
FIGURE 8 GLOBAL CARBON FIBER COMPOSITES MARKET BY END-USER INDUSTRY, USD BILLION, 2018-2030
FIGURE 9 GLOBAL MARKET BY MATRIX MATERIAL, USD BILLION, 2018-2030
FIGURE 10 GLOBAL MARKET BY REGION, USD BILLION, 2018-2030
FIGURE 11 PORTER’S FIVE FORCES MODEL
FIGURE 12 GLOBAL MARKET BY END-USER INDUSTRY, USD BILLION
FIGURE 13 GLOBAL MARKET BY MATRIX MATERIAL, USD BILLION
FIGURE 14 GLOBAL MARKET BY REGION, USD BILLION
FIGURE 15 NORTH AMERICA MARKET SNAPSHOT
FIGURE 16 EUROPE MARKET SNAPSHOT
FIGURE 17 SOUTH AMERICA COMPOSITES MARKET SNAPSHOT
FIGURE 18 ASIA PACIFIC MARKET SNAPSHOT
FIGURE 19 MIDDLE EAST ASIA AND AFRICA MARKET SNAPSHOT
FIGURE 20 MARKET SHARE ANALYSIS
FIGURE 21 TORAY INDUSTRIES INC.: COMPANY SNAPSHOT
FIGURE 22 DOWAKSA: COMPANY SNAPSHOT
FIGURE 23 MITSUBISHI CHEMICAL CORPORATION: COMPANY SNAPSHOT
FIGURE 24 SOLVAY: COMPANY SNAPSHOT
FIGURE 25 TEIJIN LIMITED: COMPANY SNAPSHOT
FIGURE 26 SGL CARBON: COMPANY SNAPSHOT
FIGURE 28 HEXCEL CORPORATION: COMPANY SNAPSHOT
FIGURE 29 HYOSUNG ADVANCED MATERIALS: COMPANY SNAPSHOT
FIGURE 30 ZHONGFU SHENYING CARBON CO., LTD.: COMPANY SNAPSHOT
FIGURE 31 FORMOSA PLASTICS CORPORATION: COMPANY SNAPSHOT
FIGURE 32 JIANGSU HENGSHEN CO., LTD.: COMPANY SNAPSHOT
FIGURE 33 JILIN CHEMICAL FIBER GROUP CO., LTD: COMPANY SNAPSHOT
Select PDF License
Single User: $2000
Multiple Users: $3000
Corporate Users: $4000